In photography, depth of field refers to how much of the picture is in focus. A shallow depth of field can produce a striking image by keeping attention on a single subject, but it also means the rest of the scene fades into the background. A deeper depth of field brings more of the picture into focus, creating a more balanced and durable image which holds up even as conditions change. As we look ahead to 2026, we believe markets are entering a similar phase. For several years, a narrow group of large U.S. companies has driven a significant share of returns, and that focus has served investors well. Today, however, elevated valuations, shifting policy dynamics, and a broadening opportunity set argue for increasing the “depth of field” in portfolios. We believe it is important to maintain exposure to innovation and growth while bringing more of the investment landscape into focus to improve resilience over time.
2025 Market Review
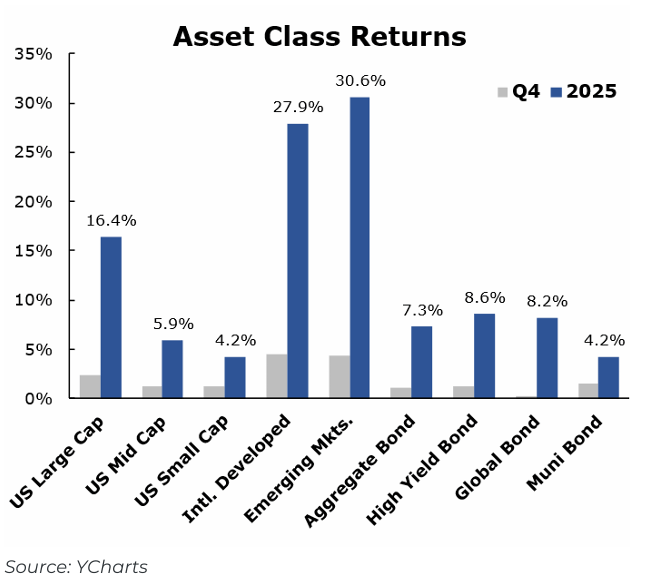
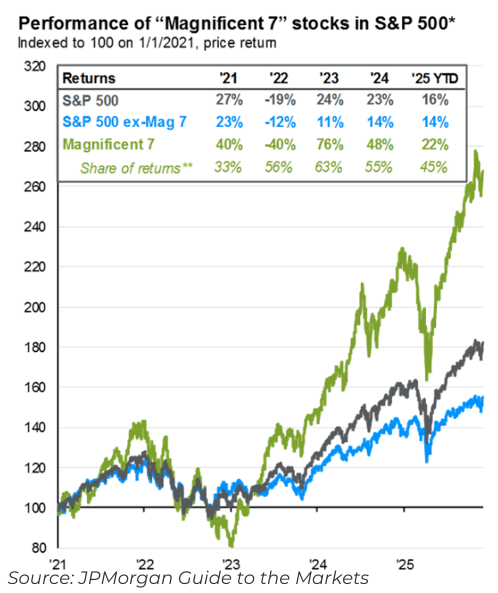
U.S. equities delivered solid gains, driven largely by continued strength in a small group of large technology companies benefiting from artificial intelligence–related investment and earnings growth. The “Magnificent 7” accounted for a significant share of headline returns, reinforcing the innovation-led leadership and the growing concentration risk beneath the surface. At the same time, international markets staged a notable rebound, outperforming U.S. equities as valuations normalized, earnings expectations improved, and a weaker U.S. dollar provided a tailwind. Fixed income also reasserted its relevance as yields remained elevated and income became a meaningful component of total return after years of near-zero rates. The year was marked by policy driven volatility, with markets repeatedly recalibrating expectations around inflation, Federal Reserve policy, fiscal incentives, and trade dynamics. Overall, the year rewarded investors who stayed invested, but it also highlighted the importance of diversification.
Economic & Policy Backdrop
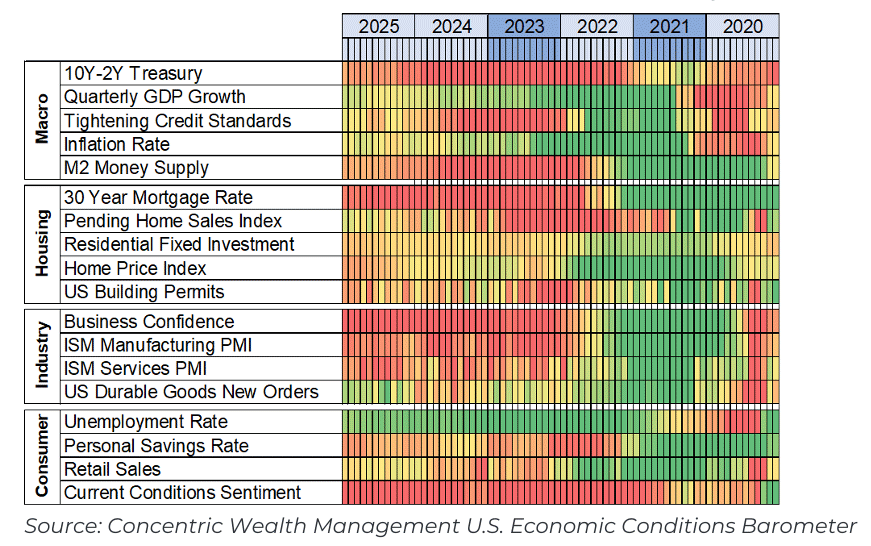
The economic backdrop entering 2026 remains constructive, though increasingly uneven and shaped by policy decisions. Growth has held up better than many expected, but it has taken on a distinctly K-shaped pattern, with higher-income households and asset owners continuing to drive spending while lower-income consumers remain more sensitive to higher prices and borrowing costs. Business investment has also remained resilient, supported part by provisions of the One Big Beautiful Bill Act (OBBBA), including the return of 100% bonus depreciation and full expensing of research and development, which incentivize capital spending early in the year. At the same time, investment in artificial intelligence has become a meaningful contributor to growth, now representing approximately 1.2%–1.3% of U.S. GDP, with spending still increasing at a high single-digit pace. Labor markets remain relatively tight, reflecting lower immigration levels that have constrained labor supply even as early productivity gains from technology adoption begin to emerge.
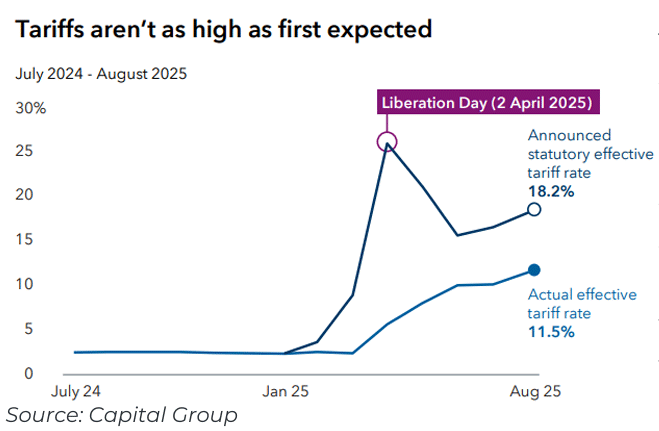
Trade policy remains an important swing factor. If current tariffs are rolled back or ruled unconstitutional, prices are unlikely to fall meaningfully, but corporate margins could improve as previously passed-through costs remain in place, supporting earnings growth and easing inflation pressures at the margin. If tariffs remain in effect through 2026, their influence could shift from a near term inflationary headwind to a more persistent macroeconomic force, contributing to uneven growth across sectors and reinforcing the K-shaped nature of the economy. In either case, tariffs are unlikely to derail the broader expansion on their own, but they do add uncertainty and increase the likelihood of periodic market volatility as businesses and investors adjust to evolving policy outcomes.
What’s Going On With The Fed
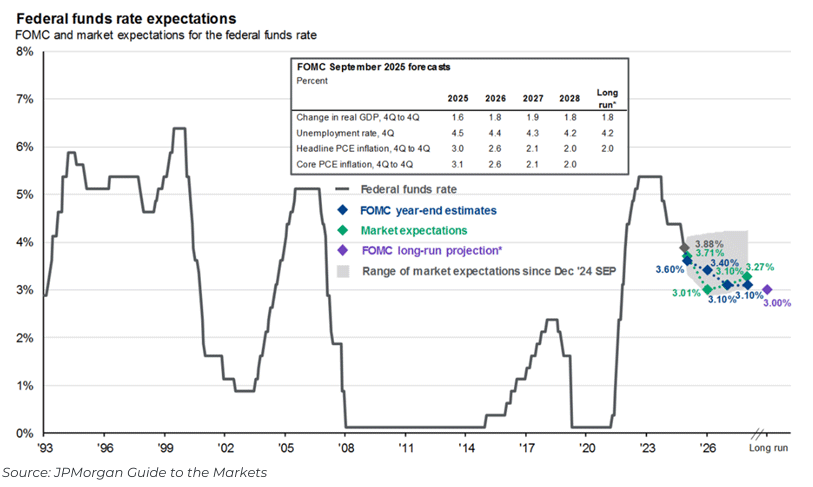
Monetary policy is transitioning from restraint toward normalization as inflation continues to moderate. After one of the most aggressive rate-hiking cycles in decades, the Federal Reserve has shifted its focus from fighting inflation at all costs to balancing price stability with labor market conditions. With inflation trending lower and job growth slowing but not collapsing, the Fed is expected to begin a gradual easing cycle, with markets currently anticipating two to three rate cuts over the course of 2026. Importantly, policymakers appear intent on moving carefully, as inflation remains above long-term targets and fiscal and trade policy continue to influence prices. Long-term interest rates are therefore likely to remain rangebound, rather than falling sharply, which may lead to periodic volatility as investors reassess the pace and extent of easing. In this environment, the opportunity in fixed income is less about predicting the exact path of rates and more about earning income and being flexible. Any reacceleration in inflation or unexpected weakening in the labor market could alter the Fed’s path to take a slower approach.
U.S. Equity Markets
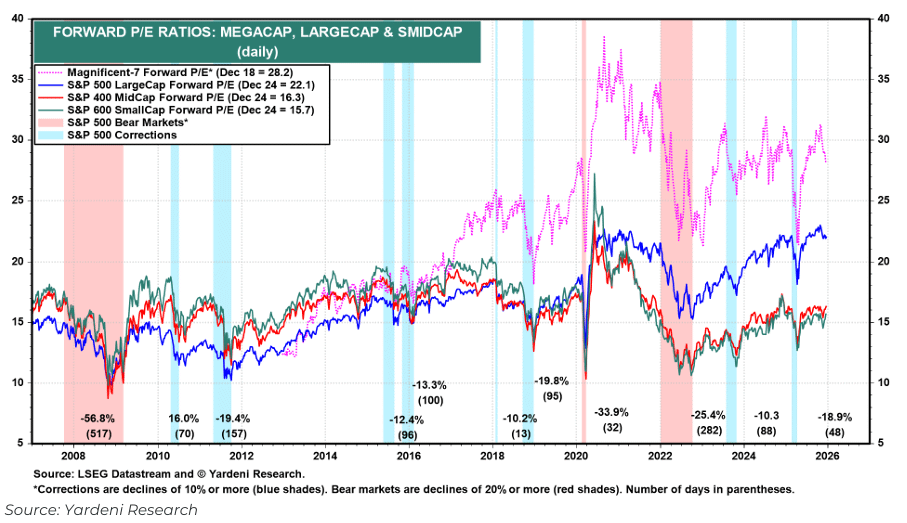
Large-cap U.S. companies continue to form the core of equity portfolios, supported by strong balance sheets, global scale, and durable cash flows. Over the past several years, returns have been heavily influenced by a small group of market leaders referred to as the “Magnificent 7” (Apple, Amazon, NVIDIA, Tesla, Meta, Alphabet, and Microsoft). In 2025 alone, these companies accounted for approximately 45% of the S&P 500’s total return and representing about 34% of the index’s overall weight. This concentration reflects their exceptional earnings growth and leadership in areas such as artificial intelligence, but it also highlights how dependent headline market performance has become on a narrow set of outcomes. We continue to view these companies as long-term innovators, but high current valuations means future returns must be driven by continued outsized earnings growth and leaves little room for valuation multiple expansion.
After an extended period of underperformance, small-cap valuations are meaningfully lower than those of large companies, which provides a more forgiving starting point if growth continues at even a modest pace. These companies also tend to benefit more directly from improving financial conditions as interest rates come down, since borrowing costs matter more for smaller businesses. Importantly, most small-cap companies generate the majority of their revenue within the U.S., which can help reduce exposure to global trade tensions and currency swings. At the same time, domestic investment incentives and infrastructure spending tend to flow more directly to smaller, capital-intensive businesses. While small-cap stocks can be more volatile and sensitive to economic slowdowns, we foresee multiple avenues for small caps to meaningfully participate as market leadership broadens.
International & Emerging Equity Markets
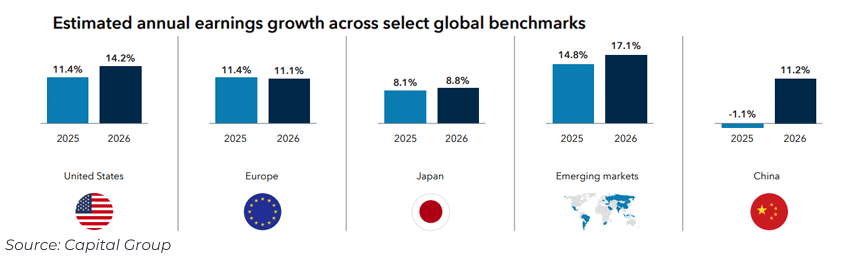
While U.S. companies have led global earnings growth for much of the past decade, consensus estimates now point to roughly 9–11% earnings growth for international equities in 2026, broadly comparable to expectations for the U.S. market. This improvement reflects a combination of stabilizing global growth, increased fiscal spending in Europe and Japan, and a growing emphasis on shareholder returns abroad. Valuations remain meaningfully lower than in the U.S., where equity markets continue to trade at a significant premium. Emerging markets add another layer of opportunity, with countries such as Korea, Taiwan, and parts of Asia playing a critical role in global technology and artificial intelligence supply chains. A weakening U.S. dollar, which has historically accompanied Federal Reserve rate-cutting cycles, has also tended to support returns abroad. That said, international and emerging markets are subject to higher volatility, currency fluctuations, and geopolitical uncertainty, which can lead to periods of uneven performance.
Fixed Income Markets
For much of the past decade, bonds played a limited role in portfolios. Interest rates were low, income was scarce, and fixed income often served primarily as a stabilizer rather than a meaningful source of return.
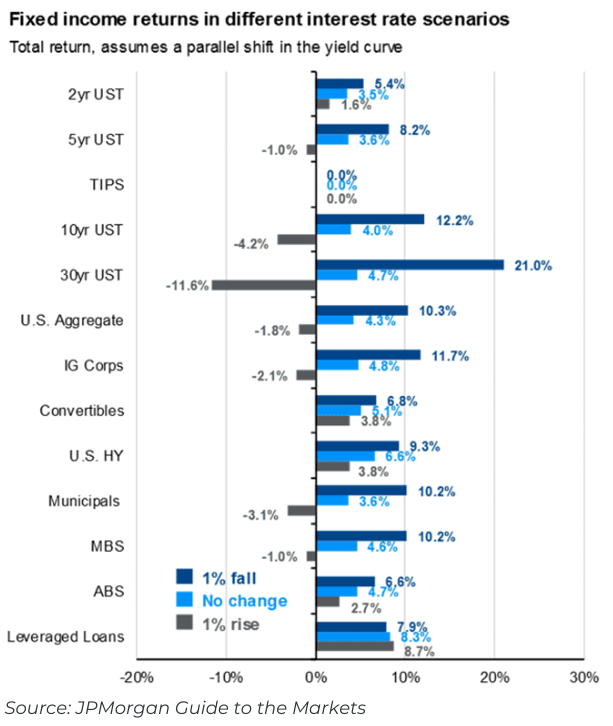
Today, yields across many areas of the bond market are the most attractive they’ve been in years. With inflation moderating and the Federal Reserve expected to continue on a gradual rate-cutting cycle, bonds are once again positioned to contribute in multiple ways: providing income, helping manage volatility, and offering diversification alongside equities.
We are not relying on a single interest rate outcome as long-term rates are likely to stay where they are, and markets may continue to experience periods of rate volatility should expectations shift. In this environment, the opportunity in bonds is less about earning income while balancing where risk is taken.
We see attractive opportunities across higher-quality bonds where compensation for taking modest risk has improved as spreads have moved back toward more normal levels while seeking to avoid lower quality segments where returns may not adequately compensate investors for potential downside.
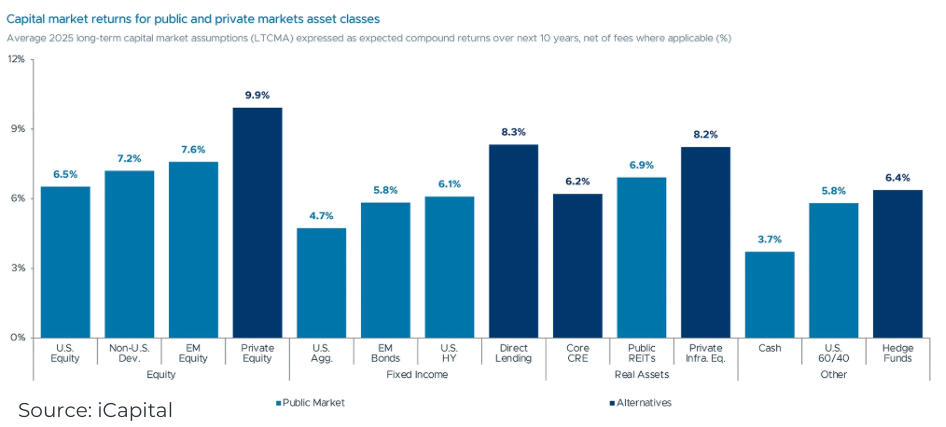
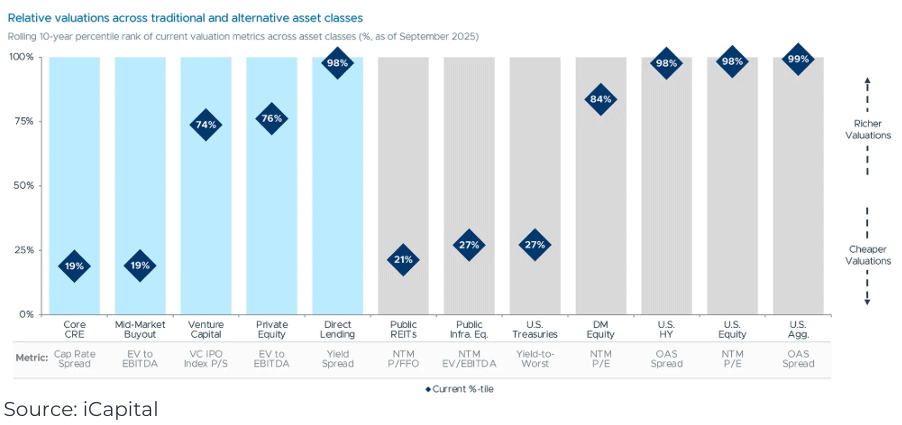
Alternatives & Private Markets
Alternative investments and private markets are playing a more meaningful role in portfolio construction as the market environment evolves. The importance of diversified and differentiated sources of return has become a more focused discussion point after an extended period of public equity domination, higher interest rates, heightened valuations, and tight market concentration. Private markets, including private equity, private credit, infrastructure, and select real asset strategies, can provide exposure to long-term growth themes, income generation, and return streams that are less directly tied to public market movements.
Conditions within private markets are also shifting. Following the market slowdown in 2022, mergers, acquisitions, and IPO activity have begun to recover, improving the backdrop for liquidity and exits. This is particularly relevant for private equity, where a significant inventory of portfolio companies has built up over recent years. As financing conditions improve and capital markets reopen, the traditional liquidity premium associated with private investments may begin to reassert itself after a period of underperformance relative to public equities.
At the same time, we are placing a heightened emphasis on manager selection and structure. Over the past few years, a number of evergreen or semi-liquid alternative funds have transitioned toward more public or exchange-traded structures. In several cases, market pricing for these vehicles has moved materially below reported net asset value (NAV), reflecting the challenges of valuing illiquid underlying investments in a daily-priced or publicly traded format. These discounts do not necessarily imply deterioration in the underlying assets, but they do highlight the importance of understanding fund structure, liquidity terms, valuation methodology, and alignment between pricing and asset realization timelines.
Our 2026 Portfolio Positioning
Just as increasing the depth of field in a photograph brings more of the picture into focus, our portfolio adjustments are designed to broaden the sources of return and reduce reliance on a narrow set of outcomes. In response to evolving market conditions, we are making a series of measured changes across client portfolios over time. These adjustments are not driven by short-term market forecasts, but by a desire to address concentration risk and better align portfolios with a broadening opportunity set. Specifically, we are modestly reducing exposure to U.S. large-cap growth stocks, where valuations and expectations are elevated, and reallocating toward areas with more attractive relative value and improving fundamentals, including U.S. small-cap stocks and international and emerging market equities. We are also leaning more meaningfully into differentiated alternative investments, where appropriate, to enhance diversification and reduce reliance on traditional stock and bond returns alone. Importantly, these changes are scaled based on each portfolio’s overall equity exposure and individual risk profile, and they are intended to strengthen portfolio resilience without altering our long-term investment discipline.
Summary: Staying Resilient
Taken together, the current environment calls for perspective rather than prediction. In photography, increasing the depth of field doesn’t change the subject rather lit brings more of the scene into focus so the image holds up across changing light and conditions. That is how we are approaching portfolios today. Economic growth remains intact but uneven, policy decisions continue to shape short-term outcomes, and market leadership is beginning to broaden beyond a narrow group of companies. By maintaining exposure to long-term growth, emphasizing income where it is now available, expanding global diversification, and being selective in alternatives and manager selection, we are positioning portfolios to rely less on any single outcome and more on a wider, more resilient opportunity set.
While periods of volatility are inevitable, we believe this approach is consistent with staying invested, staying disciplined, and staying focused on long-term goals. As always, we encourage you to reach out with questions or concerns—our role is not only to manage portfolios, but to provide clarity and guidance as the picture evolves.

Disclosures
Asset allocation does not assure or guarantee better performance and cannot eliminate the risk of investment losses. Information has been obtained from sources believed to be reliable, though not independently verified. Any forecasts are hypothetical and represent future expectations and not actual return volatilities and correlations will differ from forecasts. This report does not represent a specific investment recommendation. The opinions and analysis expressed herein are based on Concentric Wealth Management research and professional experience and are expressed as of the date of this report. Please consult with your advisor, attorney and accountant, as appropriate, regarding specific advice. Past performance does not indicate future performance and there is risk of loss. All investing involves risk including loss of principal. No strategy assures success or protects against loss There is no guarantee that a diversified portfolio will enhance overall returns or outperform a non-diversified portfolio.
Diversification does not protect against market risk. Rebalancing a portfolio may cause investors to incur tax liabilities and/or transaction costs and does not assure a profit or protect against a loss. The fast price swings in commodities will result in significant volatility in an investor’s holdings. Commodities include increased risks, such as political, economic, and currency instability, and may not be suitable for all investors.
When referencing asset class returns or statistics, the following indices are used to represent those asset classes, unless otherwise noted. Each index is unmanaged, and investors can not actually invest directly into an index:
US Large Cap – S&P 500 Total Return
US Mid Cap – S&P 400 Total Return
US Small Cap – S&P 600 Total Return
International Developed – MSCI EAFE Total Return
Emerging Markets – MSCI Emerging Markets Total Return
Aggregate Bond – Bloomberg US Aggregate
High Yield Bond – Bloomberg US Corporate High Yield
Global Bond – Bloomberg Global Aggregate
Municipal Bond – Bloomberg Municipal Bond
Domestic Equity can be volatile. The rise or fall in prices take place for a number of reasons including, but not limited to changes to underlying company conditions. International Equity can be volatile. The rise or fall in prices take place for a number of reasons including, but not limited to changes to underlying company conditions. Fixed Income securities are subject to interest rate risks, the risk of default and liquidity risk. U.S. investors exposed to non-U.S. fixed income may also be subject to currency risk and fluctuations. Cash may be subject to the loss of principal and over a longer period of time may lose purchasing power due to inflation sector or industry factors, or other macro events. These may happen quickly and unpredictably. International equity allocations may also be impacted by currency and/or country specific risks which may result in lower liquidity in some markets.
Marketable Alternatives involves higher risk and is suitable only for sophisticated investors. Along with traditional market risks, marketable alternatives are also subject to higher fees, lower liquidity and the potential for leverage that may amplify volatility or the potential for loss of capital. Additionally, short selling involved certain risks including, but not limited to additional costs, and the potential for unlimited loss on certain short sale positions.
S&P Total Return 500 – Covers the 500 largest companies that are in the United States. These companies can vary across various sectors.
S&P MidCap 400 Total Return Index- A stock market index from S&P Dow Jones Indices. The index serves as a barometer for the U.S. mid-cap equities sector and is the most widely followed mid-cap index.
S&P SmallCap Total Return 600 – Seeks to measure the small-cap segment of the U.S. equity market. The index is designed to track companies that meet specific inclusion criteria to ensure that they are liquid and financially viable.
MSCI EAFE Total Return Index – An equity index which captures large and mid cap representation across 21 Developed Markets countries* around the world, excluding the US and Canada. The index covers approximately 85% of the free float adjusted market capitalization in each country.
MSCI Emerging Markets Total Return Index – Captures large and mid cap representation across 25 Emerging Markets (EM) countries. The index covers approximately 85% of the free float-adjusted market capitalization in each country.
Bloomberg US Aggregate Bond Total Return Index – Used as a benchmark for investment grade bonds within the United States.
Bloomberg US Corporate High Yield Total Return Index – Covers performance for United States high yield corporate bonds. This index serves as an important benchmark for portfolios that include exposure to riskier corporate bonds that might not necessarily be investment grade.
Bloomberg Global Aggregate Total Return Index – Measures the performance of global investment grade fixed income securities. This index is widely used as a benchmark for fixed income securities.
Bloomberg Municipal Total Return Index – Serves as a benchmark for the US municipal bond market. Investing involves risks, and investment decisions should be based on your own goals, time horizon, and tolerance for risk. The return and principal value of investments will fluctuate as market conditions change. When sold, investments may be worth more or less than their original cost. Indexes discussed are unmanaged and you cannot directly invest into an index. Past performance is not a guarantee of future results.
Securities and advisory services offered through LPL Financial, a registered investment advisor, Member FINRA/SIPC.